


Best React Chart Libraries
Best React Chart Libraries
Best React Chart Libraries for 2025
Introduction
In today’s data-driven world, users expect more than just static information—they want interactive, real-time visual insights. Charts are no longer just a bonus feature; they are essential to any application dealing with analytics, reports, or user metrics. Whether you're building financial dashboards, healthcare analytics tools, or SaaS admin panels, choosing the right charting solution is critical. React chart libraries offer pre-built components that simplify complex logic, integrate seamlessly into React’s virtual DOM, and improve data visualization without compromising performance. In this blog, we’ll explore the top React chart libraries dominating 2025 and help you choose the right one based on your specific needs.
What Are React Chart Libraries?
React chart libraries are specialized libraries or frameworks that offer ready-to-use chart components optimized for React applications. These libraries abstract away the complexity of rendering visual data by providing hooks, components, and utilities that align with React's declarative programming model. Instead of managing raw SVG or Canvas rendering logic, developers can use clean JSX code to create powerful data visualizations.
These libraries are particularly useful for creating:
- Dynamic Dashboards
- Performance Reports
- Financial Charts
- Business Intelligence Interfaces
- Health and IoT Visualizations
They allow real-time data binding, customizable themes, animation controls, and cross-platform responsiveness—all essential features for modern web apps. Developers save time on repetitive tasks like tooltip logic or responsiveness and focus more on user experience and actionable insights.
Why Use React Chart Libraries?
The advantages of using a dedicated React chart library go beyond aesthetics. Here are key benefits that make them indispensable:
- Easy Integration with React: These libraries are purpose-built for React, often offering plug-and-play components that align with props, hooks, and state logic.
- Customization Options: Developers can fine-tune every aspect of the chart—colors, tooltips, axes, animations—to match branding and UX requirements.
- Time-Saving: Avoid reinventing the wheel. Most libraries come with pre-built charts and templates that speed up development.
- Dynamic Charts: Support for animations, live updates, and interactive elements makes it easy to create visually compelling and informative data displays.
- Enhanced User Experience: Good data visualization reduces cognitive load and makes data easier to interpret, increasing the usability of your application.
From a business standpoint, well-designed charts can improve decision-making by presenting data in digestible, meaningful ways.
Top React Chart Libraries to Consider in 2025
1. Recharts

Overview:
Recharts is a composable charting library built specifically for React. It leverages D3 under the hood while exposing a simple and intuitive API for building basic to moderately complex charts.
Pros: Clean syntax, reusable components, responsive by default, active community
Cons: Limited to standard chart types, struggles with highly customized or advanced use cases
Ideal Use Case: Internal dashboards, admin panels, early-stage MVPs
2. React-Chartjs-2

Overview:
This library wraps the well-known Chart.js library into React components, offering simplicity and speed for straightforward charting needs. It supports bar, line, pie, radar, and other basic charts.
Pros: Lightweight, responsive, easy to integrate, great for beginners
Cons: Not suitable for complex data transformations, less flexible for custom logic
Ideal Use Case: Mobile-first apps, educational dashboards, performance monitoring tools
3. Victory

Overview:
Developed by Formidable Labs, Victory is a highly modular and extensible charting library with strong React-native support. It emphasizes design and accessibility.
Pros: Highly customizable, polished UI, animated transitions, well-documented
Cons: Slightly steeper learning curve, larger bundle size compared to minimalist libraries
Ideal Use Case: Marketing analytics, UX-focused dashboards, React Native apps
4. Nivo
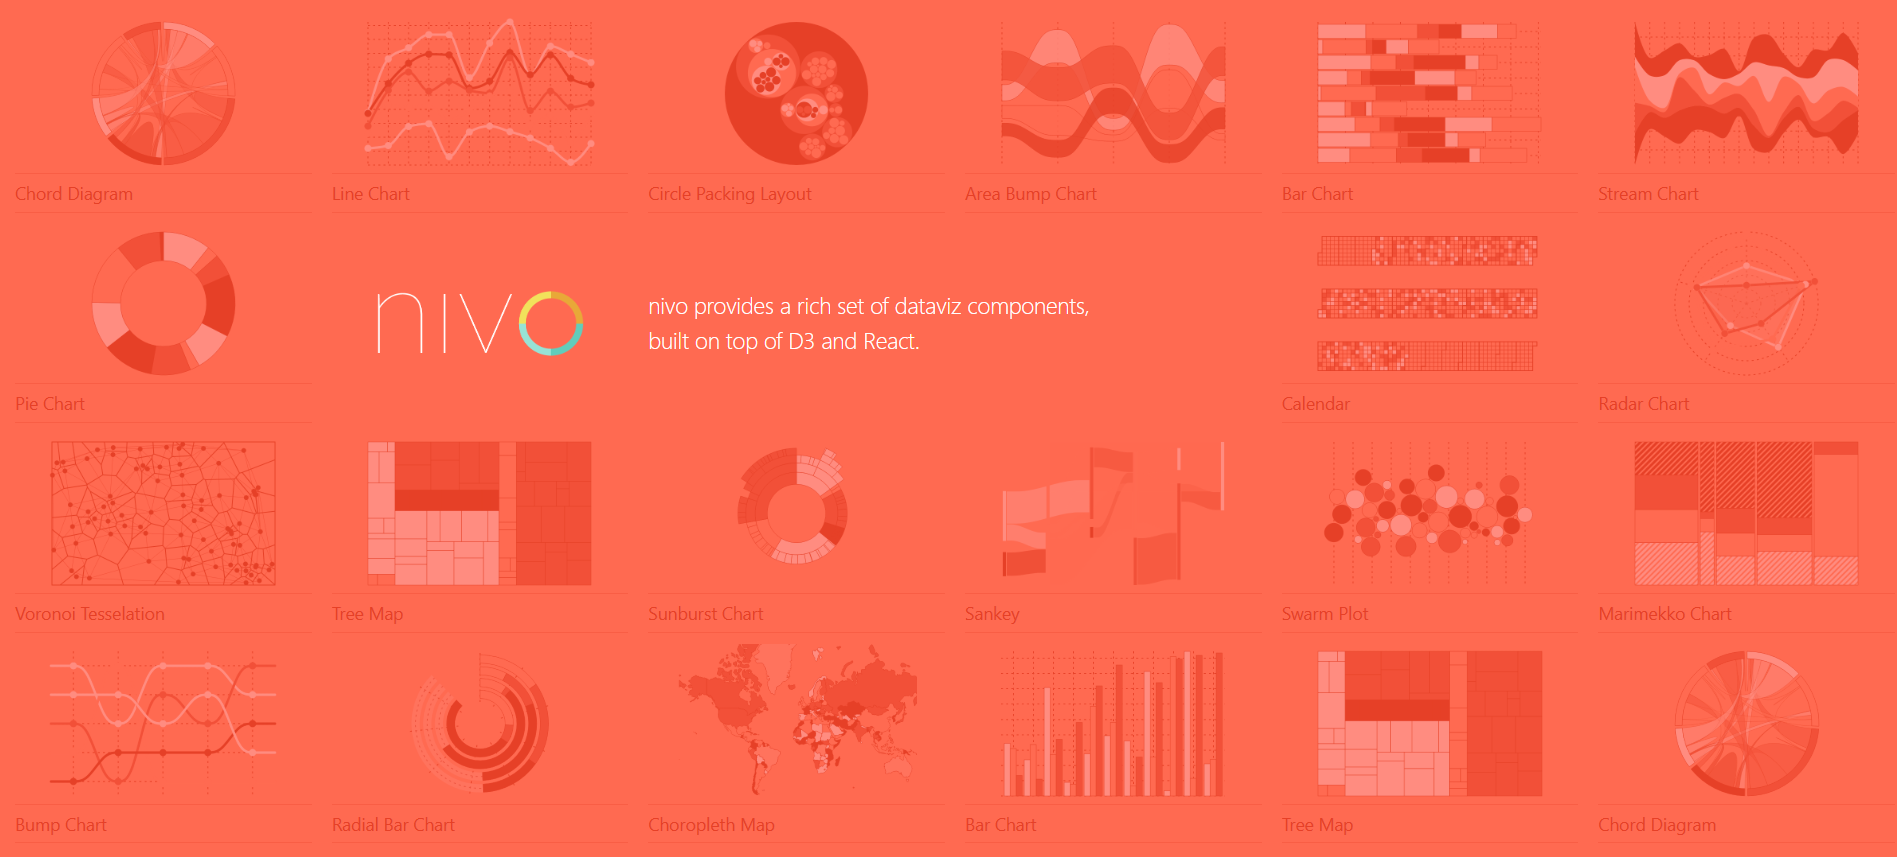
Overview:
Nivo is a visual powerhouse built on top of D3. It offers a wide range of responsive and animated charts, supporting both SVG and Canvas rendering.
Pros: Stunning visuals, SSR-ready, high customization
Cons: Complex initial setup, bulkier package
Ideal Use Case: Enterprise-grade applications, data-rich dashboards, cross-platform charts
5. Visx (from Airbnb)

Overview:
Visx isn’t a traditional chart library. It's a collection of low-level primitives that merge D3’s power with React’s flexibility, offering full control to build custom charts from scratch.
Pros: Unmatched flexibility, excellent performance, code composability
Cons: Not beginner-friendly, requires solid understanding of D3 and SVG
Ideal Use Case: Bespoke visualizations, data journalism, high-performance UIs
6. React-Vis (by Uber)

Overview:
React-Vis is a simplified yet powerful charting solution from Uber. It covers basic visualizations and offers ease of use for fast prototyping.
Pros: Intuitive API, consistent theming, strong developer tools
Cons: Limited in depth and advanced interactivity features
Ideal Use Case: Internal analytics, MVPs, lightweight dashboards
7. Apache ECharts for React

Overview:
Apache ECharts is known for its robust feature set, supporting complex, interactive charts with real-time streaming, 3D views, and advanced animations.
Pros: Feature-rich, cross-browser compatibility, strong community backing
Cons: Verbose API, documentation can be overwhelming
Ideal Use Case: Complex business dashboards, IoT visualizations, financial data tracking
8. BizCharts

Overview:
Powered by G2 and maintained by Alibaba, BizCharts is a full-featured charting library for React with powerful configuration options.
Pros: Supports custom schemas, excellent visual fidelity
Cons: Limited English documentation, fewer community tutorials
Ideal Use Case: E-commerce analytics, regional dashboards in APAC
9. D3.js with React

Overview:
While not designed for React, D3 can be integrated with React to create pixel-perfect, highly customized data visualizations.
Pros: Absolute control, limitless design possibilities, real-time capabilities
Cons: High complexity, steep learning curve, verbose code
Ideal Use Case: Scientific research, media visualizations, interactive storytelling
10. Plottable

Overview:
Plottable is a structured charting library built on top of D3 that offers more consistency and modularity.
Pros: Strong layout system, modularity, good for structured output
Cons: Less active development, limited community resources
Ideal Use Case: Scientific dashboards, structured financial reports
Comparison Table of Top React Chart Libraries
How to Choose the Right React Chart Library?
Not all chart libraries are created equal—and not all projects demand the same level of complexity. Here are some criteria to help you decide:
- Project Complexity: For simple dashboards, Recharts or React-Chartjs-2 will suffice. For advanced interactions, opt for Nivo or Visx.
- Performance Requirements: If you're targeting mobile or low-bandwidth users, go with lightweight libraries like Chart.js wrappers.
- Customization Needs: Need granular control? Choose libraries like D3.js, Visx, or Victory.
- Learning Curve vs. Output: If time is short and the team is small, stick with plug-and-play options like Recharts.
Final Recommendation: Don’t look for the "best" library. Instead, find the right one for your context. Prototype with a few options, evaluate performance, test customization limits, and match your UX goals.
Conclusion
In the evolving world of React development, choosing the right chart library isn’t just a technical decision—it’s a strategic one. Whether you're prioritizing speed, visual polish, customization, or scalability, the right charting tool can elevate your entire application’s impact. From the simplicity of Recharts to the raw power of D3.js, every library on this list brings something unique to the table. The real magic happens when you align your choice with your project’s goals, your team’s expertise, and your users' expectations. So test boldly, iterate quickly, and remember—great data deserves great design.
FAQ
More reads


